
Uncertainty
The goal of calculating uncertainty is to assess how our power outputs are affected by uncertainty in our instruments and measuring techniques. Uncertainties in height, weight, jump height, calf and thigh circumference, and flight time were estimated and then combined to give us an estimate of the potential uncertainty in our experimental method.

As noted in our data collection section, we used the Johnson Bahamonde equations (below) to determine the power exerted by the participants when they tried jumping as high as possible. The variables in these equations are height, weight, and jump height. Using these equations, we are able to mathematically show that some participants are more powerful than others. Interestingly, the Johnson and Bahamonde experiment also measured leg girth; however, they did not utilize those measurements in their power equations. As a creative extension of their research, we attempted to create an equation of our own, relating BMI, jump height, and leg size, to predict power output. We derived this equation empirically my analyzing our data. We determined the relative uncertainties and their percent contributions to the outputs of all the equations we utilized.
Equations:
Johnson Bahamonde Equations
Body Mass Index Equation

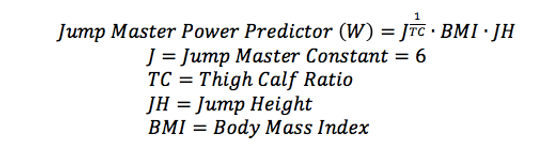
Jump Master Power Predictor Equation
Sources of Uncertainty
Jump Height

Figure 1. Possible sources of error and estimated uncertainties in jump height measurements.

Figure 2. Possible sources of error and estimated uncertainties in measuring subjects' height.
Subject Height
Subject Weight

Figure 3. Possible sources of error and estimated uncertainties in measuring subjects' weight.
Calf and Thigh Circumference

Figure 4. Possible sources of error and estimated uncertainties in measuring subjects' calf and thigh circumference. The uncertainty in these measurements will be used in our power prediction equation.
Uncertainty of Power Calculations

Figure 5. Given the calculated combined uncertainties, the relative uncertainty and uncertainty percent contribution were calculated when an estimated nominal value was chosen as a data point. The table shows that relative uncertainty in the jump height is the greatest. Most sources of uncertainty in this measurement arose from human performance issues.
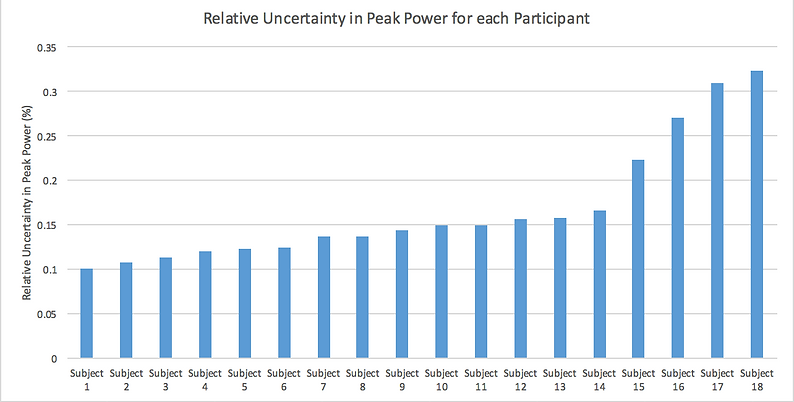
Figure 6. Relative error for each subject's calculated peak power output of combined uncertainties for power.

Figure 7. Graph displaying the uncertainty percent contribution of height, mass and jump height uncertainties in the Johnson Bahamonde peak power equation. As seen in the graph, jump height contributes the most to the total uncertainty. The jump height uncertainty for each subject was greater than 95%. This makes sense because the combined uncertainty of our jump height was 3.416 inches (refer to Figure 1), which had the largest relative uncertainty compared to the nominal value.

Figure 8. Relative uncertainty for each subject's calculated average power output of relative uncertainties for power.

Figure 9. Graph displaying percent contribution of height, weight and jump height uncertainties. Our UPCs for each instrument for the average power were equal. This caught us by surprise, but after redoing the calculations six times, these numbers were deemed as accurate. We concluded that there must be some correlation between each variable as the uncertainties grow and shrink that made this happen.
Uncertainty of BMI Calculations

Figure 10. Relative uncertainty of BMI. Many of the uncertainties are less than 5% of the calculated BMI values.

Figure 11. Uncertainties in BMI measurements arose mainly from measuring participant height with the tape measure because there was more user error associated with this instrument. The digital scale uncertainty mainly arose from random fluctuations out of our control. The best way to reduce uncertainty in BMI would be to use a more standard method of measuring height.
Uncertainty of Jump Master Equation Calculations

This is our Jump Master Power Predictor equation analysis. We wanted to figure out how we could predict peak power output by using BMI, jump height, and our thigh and calf measurements. After many unsuccessful iterations, this is the equation that was the most accurate. Our equation predicted high most of the time but was relatively accurate in predicting those with higher Thigh-to-Calf (TC) ratios.
Figure 12. These are our partial derivatives used in calculating the uncertainties involved in our created Jump Master equation. These were to calculate the uncertainty magnification factors (UMF) for each variable in our equation.

Figure 13. Uncertainty budget for our Jump Master Power Predictor equation given uncertainties and estimated nominal values. The jump height, as in the Johnson Bahamonde equation, contributed the most to the uncertainty.

Figure 14. Relative uncertainty of our JME compared to our predicted value.
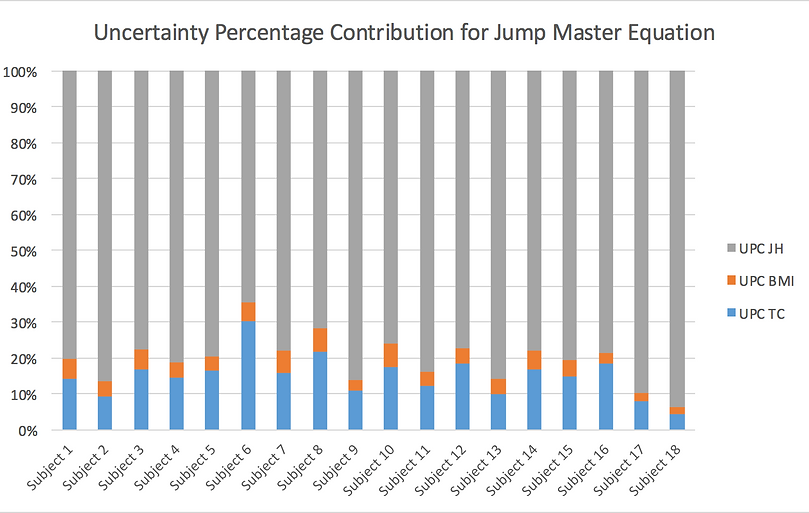
Figure 15. Uncertainty percent contribution of the variables: Jump height (JH), Body Mass Index (BMI) and Thigh Calf (TC) ratio. This UPC distribution was very similar to that of the Johnson Bahamonde equation, with the jump height measurement contributing the most to the total uncertainty.
Conclusions
Now that we have completed this analysis we can start to make conclusions about the uncertainty in our experiment. We can see from our Johnson Bahamonde Power equation analysis that jump height is our biggest uncertainty (refer to Figure 5). The sources of jump height uncertainties were outside of our control, especially those related to human performance. Random fluctuations associated with human physiology were out of our control, so we did our best to minimize any systematic errors. While the jump stand only has half inch increments, this was enough accuracy for our purpose since we took the average of five jumps anyways.
From our BMI equation we found that the height of the participant is the biggest contribution to our uncertainty. This makes sense because the height is squared. Our overall BMI uncertainty is below 5% so we do have a relatively low uncertainty, but if we want to lower that value we would have to measure the subjects height more accurately with a more consistent and standard height measuring device.
Lastly, we did an analysis involving the equation we created. We wanted to have a way to predict power by comparing many of our variables: jump height, leg girth, and BMI, which relates height and weight. The point of comparison for our equation's accuracy was the peak power values calculated by the Johnson Bahamonde equation. We found that our equation provided power outputs within 6% for 14 of 18 subjects. It worked especially well for males with large thigh-calf ratios (between 1.2 and 1.3). However, it did not work so well for females and males with TC ratios less than 1.2. To refine this equation, we could either choose a different Jump Master Constant or we would conduct more testing on females to see if the equation's predictions produced the expected results.
Though our uncertainties in jump height and power were higher than we desired, we believe that this analysis of our data and overall uncertainties can be very beneficial to future testers and for any sports team testing jump heights in respect to the instruments they use.