Through this experiment, we hoped to find out whether an ideal body type would produce a maximum jump height. Our null hypothesis predicted that there would be no correlation between jump height and variables such as height, weight, leg size and athletic participation. We established quantitative measurements of body types and compared it to the jump height of our subjects. Our project took a different course when we decided to incorporate power output as a result of jump height.
Conclusions Jumped To
By: Josh Charney
This project was very interesting to analyze and complete from the view point as an engineer, but even more so as an athlete. For years I assumed that there was some specific reason(s) why a person could jump higher or stay in the air longer; so we measured leg size in two places, height, weight, BMI, flight time, jump height, reach height, and a subjective “how athletic do you think you are?” question. Our first instinct was leg size would be directly related to jump height as that was our original premise in the beginning this project. But, after finishing the uncertainty analysis and overall statistical analysis of our data I now know that there doesn’t seem to be any attribute about a person that tends to reflect how high they can jump. In the statistical analysis page (figure 15) the ANOVA test shows that almost every category we chose to compare was not statistically significant with one another. From an athletic viewpoint this intrigues me, and I now wonder what about a person’s muscular build or maybe even skeletal structure allows for similar people to jump at different heights.
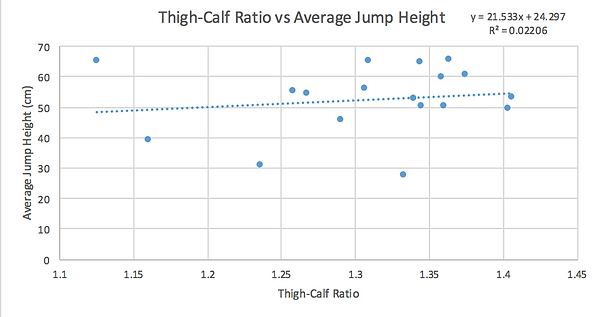
Another major finding was that it did not matter how a person’s thigh and calf measurements were. Larger sized legs jumped high as well as low. Since we used the thigh-calf ratio in our Jump Master Equation, I will use that as my focus on this conclusion point. We calculated the thigh to calf ratio and I have compared it to jump height below.

Figure 1. This is the thigh-calf ratio and average jump height comparison. This graph shows that our initial assumption that leg size was the leading cause for a higher jump was incorrect.
Our initial idea that leg size would have an impact on the height a person could jump wasn’t true. Many of our participants have very similar thigh-calf ratios, and yet there was a difference of up to 38 centimeters in average jump height. With this information in hand, we can conclude there must be something else that explains jump height. What that is, we may never know.
By: Daniel Ma
Conclusions Jumped To
By: Daniel Ma
While mathematical analysis of the relationship between power and physical traits showed the relationship to be valid, sound judgement prevents me from definitively concluding that the relationship is valid. I realize that there are far too many variables to account for. We were unable to represent every difference between our subjects, such as their activity level, physical traits and motor skills.
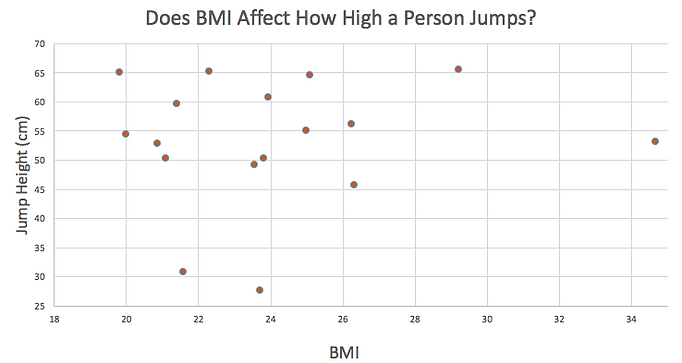
One of our initial predictions was that BMI would not affect jump height because BMI is one of the most disputed measurements. Namely, BMI does not quantify a person's muscle density or athletic ability. Surprisingly, the three people who jumped the highest had a wide spread in BMI values: 19.8, 22.3 and 29.2. Interestingly, all three participated in track and field for at least 4 years; additionally, they all competed in different events (middle distance, multi-event and throws, respective to the BMI values listed above). Despite the variation in BMI and body types, these three subjects produced the highest jumps in our sample. In Figure 2 below, there is no obvious trend between jump height and BMI.
Overall, our study was inconclusive due to the individual differences between subjects. If we had taken athletes from a single sport, such as track and field, we would have had more concrete groups for statistical comparisons since the team is already divided into event based groups. For example, we could have used event groups for the NOVA and T-test analyses. This might allow us to see which event groups better develop the muscles related to jumping. While not all athletes fit the “stereotype” of an event, such as a bulky person in the shot put or a lean distance runner, the spread of athletic ability is more normalized than choosing random people on campus with different athletic abilities due to the similar training regimens.

Figure 2. The plot of jump height versus BMI does not show any trends because the highest jumps were accomplished by subjects of differing BMI ranges.
Conclusions Jumped To
By: Luke Betteridge
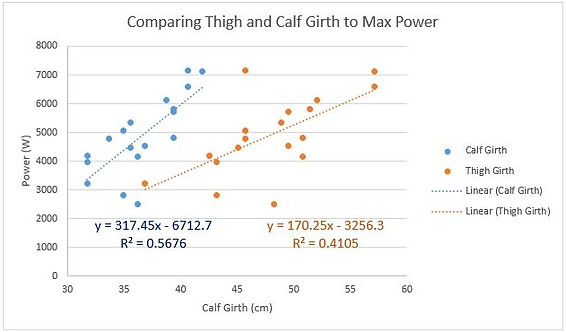
One of this project's goals was to find the best body type for the most powerful jump. We believed that a person’s BMI could be one of the most important measurements because it considered both height and weight. But we also found that the leg measurements showed an interesting correlation to power. Power and thigh girth did not have a high correlation; we believe this is because this measurement could be a combination of muscle and leg fat. But calf girth did have a high correlation to max power. This is because as a calf becomes larger it seems to be because of more muscle. Through the sensitivity analysis of our Jump Master equation, we also see that we want to minimize thigh girth and maximize calf girth for the max power in a jump. So it seems like calf size did have an important relationship to jump power as shown in the graph below with the R squared value greater than the thigh girth R squared value.

Figure 3. This graph shows how calf and thigh size effect the max power output of our Jump Master equation.
For further study, it would be interesting to try and measure the amount of muscle to the amount of fat on the subject’s legs to see if there is a point where adding more muscle makes you not be able to jump as high. This is what we were trying to achieve with our leg measurements, but we believe we would need more data and more in depth methods of measuring leg muscle to draw more conclusive results to this phenomenon.
